Top:
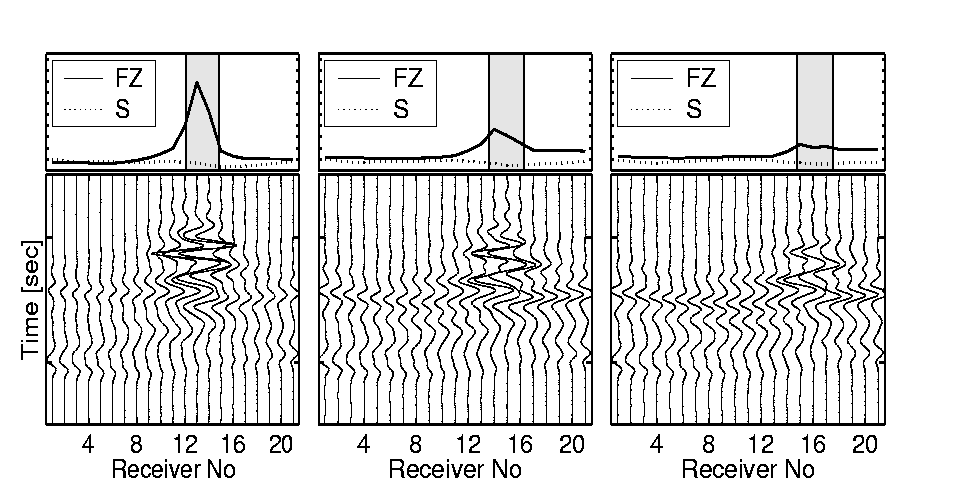
Seismograms of the y-component of velocity of a receiver line crossing the fault. Above the seismograms the distribution of maximum amplitude of S- and FZ-waves for each trace is shown. The solid line (FZ) corresponds to the FZ-wave, the dotted line (S) to the direct S-wave. The grey rectangle denotes the stations located directly above the fault. One tickmark of the amplitude scale corresponds to the maximum S-wave amplitude of all receivers. The seismograms and amplitudes are drawn to scale.- Left: Disruption of 1/2 FZ-width
- Center: Disruption of 1 FZ-width
(corresponds to the Movie)Bottom:- Right: Disruption of 1 1/2 FZ-widths
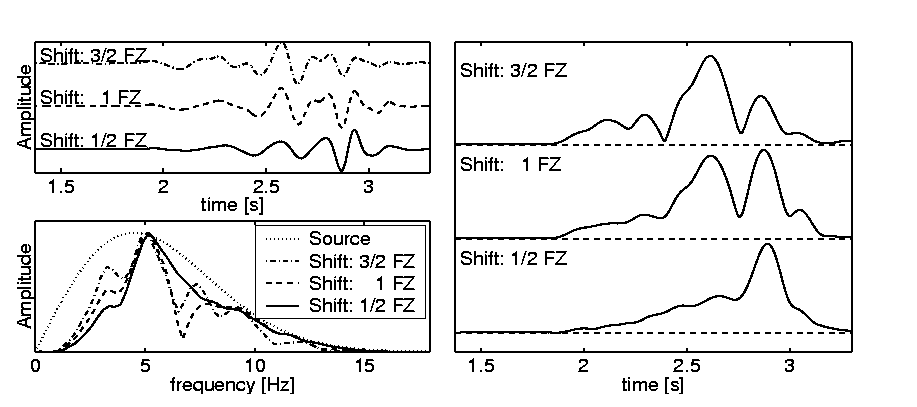
- Left: Wave forms and spectra of the y-component of the FZ-waves. Additionally, the source spectrum is shown.
- Right: Envelopes of the FZ-waves.
Main Page